

If you’re only going to track a handful of numbers, make them these: customer acquisition cost (CAC), customer lifetime value (CLV), conversion rate, cost per lead (CPL), MQL to SQL conversion, and marketing-attributed revenue. Each one ties a marketing dollar directly to a client outcome or a pipeline stage. Before you read another word, write down your current numbers for these six. That baseline is the whole point.
TL;DR:
- Tracking only CAC, CLV, conversion rate, CPL, MQL to SQL, and marketing-attributed revenue ensures direct insight into client value and pipeline efficiency.
- Setting baseline numbers over 90 days is crucial before establishing realistic short-term (10-20%) and long-term (annual revenue) targets.
- Consistent, documented naming conventions and simple CRM tracking are vital for accurate attribution across both online and offline marketing channels.
- Weekly reviews should focus on lead generation and CPL, while monthly and quarterly assessments monitor CAC trends, CLV, and revenue attribution to guide strategic decisions.
- Improving retention and reducing churn through marketing efforts like onboarding and regular engagement directly enhances CLV and the value of marketing spend.
Most service businesses drown in dashboards full of numbers that feel important but don’t move anything. Impressions look nice in a report. They don’t pay the rent. The Harvard Business School’s guide to marketing KPIs lists impressions, click-through rate, cost per click, conversion rate, CAC, and ROI as the core set worth tracking. For service businesses, a handful of these carry far more weight than the rest.
Customer acquisition cost (CAC) is your total marketing and sales spend divided by the number of new clients won in that period. If you spent a moderate amount last quarter and signed several new clients, your CAC is your total spend divided by the number of clients. On its own, that number means nothing. It only matters next to CLV.
Customer lifetime value (CLV or LTV) is the total revenue you expect from a client over the life of the relationship, minus the cost to serve them. A bookkeeping firm with a $400 CLV can’t sustain an $800 CAC. A consulting firm with a $15,000 CLV can absorb it easily. This is why the CLV:CAC ratio matters more than either number alone.
Cost per lead (CPL) differs from CAC in one important way: it measures the cost of generating interest, not the cost of closing a client. Use CPL to judge channel efficiency early in the funnel. Use CAC to judge whether your whole sales and marketing system is profitable.
Conversion rate needs a service-specific definition. For a consultant, a conversion might be a booked discovery call. For a tradie, it might be a quote request. Track both the macro conversion (enquiry to client) and the micro conversions (visit to enquiry, enquiry to booked call) because they reveal different problems.
MQLs, SQLs, and the conversion between them separate marketing’s job from sales’ job. A marketing qualified lead has shown genuine interest (downloaded a guide, booked a call). A sales qualified lead has been vetted as a real fit. The MQL to SQL conversion rate tells you whether marketing is bringing in the right people or just a lot of people.
Marketing-attributed revenue and ROAS close the loop. This is the actual dollar value your marketing activity can be credited with generating, whether you’re measuring it against pipeline value or closed revenue.
A few supporting engagement metrics round out the picture:
None of these engagement numbers matter in isolation. They’re early warning signs that feed into the KPIs above.
Start with your revenue goal and your average deal value, not with a list of metrics you found online. If you need $200,000 in new revenue this year and your average client is worth $10,000, you need 20 new clients. Work backwards from there to figure out how many leads and enquiries that requires, given your current conversion rates.
From that exercise, pick three to five KPIs that genuinely link to that goal. Everything else is noise for now.
Pro Tip: Don’t set targets before you’ve measured a baseline. Guessing at a target and then “hitting” it tells you nothing about whether your marketing actually improved.
A small consulting business earning $10,000 per client might find their CAC sits at $2,200, giving a CLV:CAC ratio around 4.5:1, comfortably healthy. If that same business found its CAC crept to $4,000, the ratio drops to roughly 2.5:1, a signal to tighten targeting before spending more.
Reliable KPI data starts with naming conventions, not fancy software. Set a consistent UTM tagging structure for every campaign, and capture the source, medium, and campaign name directly in your CRM record for each lead. Without this, you’ll spend hours each month trying to reverse-engineer where a client actually came from.
Connect your website forms to your CRM so every enquiry lands as a lead record tied to a pipeline stage, not a stray email in someone’s inbox. This single step closes the gap between marketing activity and revenue that most service businesses never manage to close.
Choose an attribution model that fits your sales cycle. A local service business with a short cycle can rely on last-touch attribution without much distortion. A consulting or B2B services firm with a multi-month sales cycle needs multi-touch attribution, because the channel that generated the enquiry is rarely the channel that closed the deal.
Most businesses don’t need enterprise software to do this well. A practical tooling path that works for small teams looks like this:
The most common pitfalls are double-counting leads across channels, leaving inbound enquiries untagged so they default to “direct,” and scoring leads inconsistently between team members. Fix these with a written naming standard and a monthly audit of ten random lead records.
A one-page dashboard beats a twenty-tab spreadsheet almost every time, because it forces you to decide what actually matters this week. The recommended cadence for professional services firms keeps operational numbers weekly and strategic numbers further apart.
Weekly: leads generated, conversion rate on enquiries, CPL by channel. Fifteen minutes, one page, no discussion of long-term strategy.
Monthly: channel-by-channel performance, CAC trend over the last three months, total pipeline value influenced by marketing.
Quarterly: updated CLV figures, marketing-attributed revenue against the quarter’s goal, and any decision to shift budget between channels.
A simple one-page template needs just four sections: this week’s leads and CPL, this month’s CAC trend, this quarter’s CLV and attributed revenue, and one line noting the single biggest change to make next period.
Choosing the right KPIs is only half the job. The harder half is building the habit of measuring, reviewing, and adjusting without letting it slide after week three. A three-phase program around exactly this gap includes an audit phase that establishes your real baseline (not a guess), an implementation phase that sets up tracking and dashboards you’ll actually use, and a review phase that builds the weekly and monthly rhythm into how you run the business.
Participants in the program have reported reduced wasted ad spend once they could finally see which channels were producing SQLs instead of just traffic, and improved conversion once lead quality became a tracked number instead of a vague impression.
If you’re starting from scratch, the practical next steps are the same three we’ve covered: run a 90-day baseline audit, build a simple dashboard around your five priority KPIs, and commit to a short weekly review, even if it’s just you and a spreadsheet for now.
Winning a client is only the first half of the equation, retaining them is what makes your CAC worth spending. Client retention rate measures the percentage of clients who stay active over a given period, typically calculated as (clients at end of period minus new clients acquired) divided by clients at start of period, multiplied by 100.
Churn rate is its mirror image: the percentage of clients who leave. For subscription-style services (retainers, ongoing support contracts), churn is easy to calculate monthly. For project-based services, it’s better tracked as a repeat-engagement rate, meaning the percentage of past clients who return for a new project within 12 months.
Marketing has more influence over retention than most business owners assume. Onboarding communication, regular check-ins, and content that keeps clients engaged between projects all fall under marketing’s remit, not just sales or delivery. A firm that treats retention purely as an operations problem misses the fact that a churned client also represents a wasted CAC.
Track retention and churn alongside your acquisition KPIs, not separately. A business acquiring clients efficiently but losing them within six months has a leaking bucket problem that no amount of lead generation will fix. Reviewing retention quarterly, alongside your CLV updates, keeps the two numbers honest against each other. If CLV is rising but retention is falling, your remaining clients are likely spending more, which is worth investigating rather than celebrating blindly.
Net Promoter Score asks one simple question: “How likely are you to recommend us to a friend or colleague?” on a scale of 0 to 10. Subtract the percentage of detractors (scores 0 to 6) from the percentage of promoters (scores 9 to 10) and you get your NPS, a number that can range from negative 100 to positive 100.
For service businesses, NPS earns its place as a marketing KPI because referrals are often the highest-converting, lowest-cost lead source you have. A client who scores you a 9 or 10 is a candidate for a testimonial, a case study, or a direct referral ask, all of which feed your top-of-funnel without touching your ad budget.
Customer satisfaction scores (CSAT) work alongside NPS but measure something narrower: satisfaction with a specific interaction or delivery, rather than overall loyalty. Use CSAT after key touchpoints (project completion, support resolution) and NPS on a broader cadence, perhaps twice a year, to track loyalty trends over time.
Neither metric replaces revenue-linked KPIs, but both act as early indicators. A dropping NPS score today often shows up as rising churn and shrinking referral volume in three to six months. Treat it as a leading indicator worth including in your quarterly review, sitting next to CLV and retention, not as a vanity survey you run once and forget.
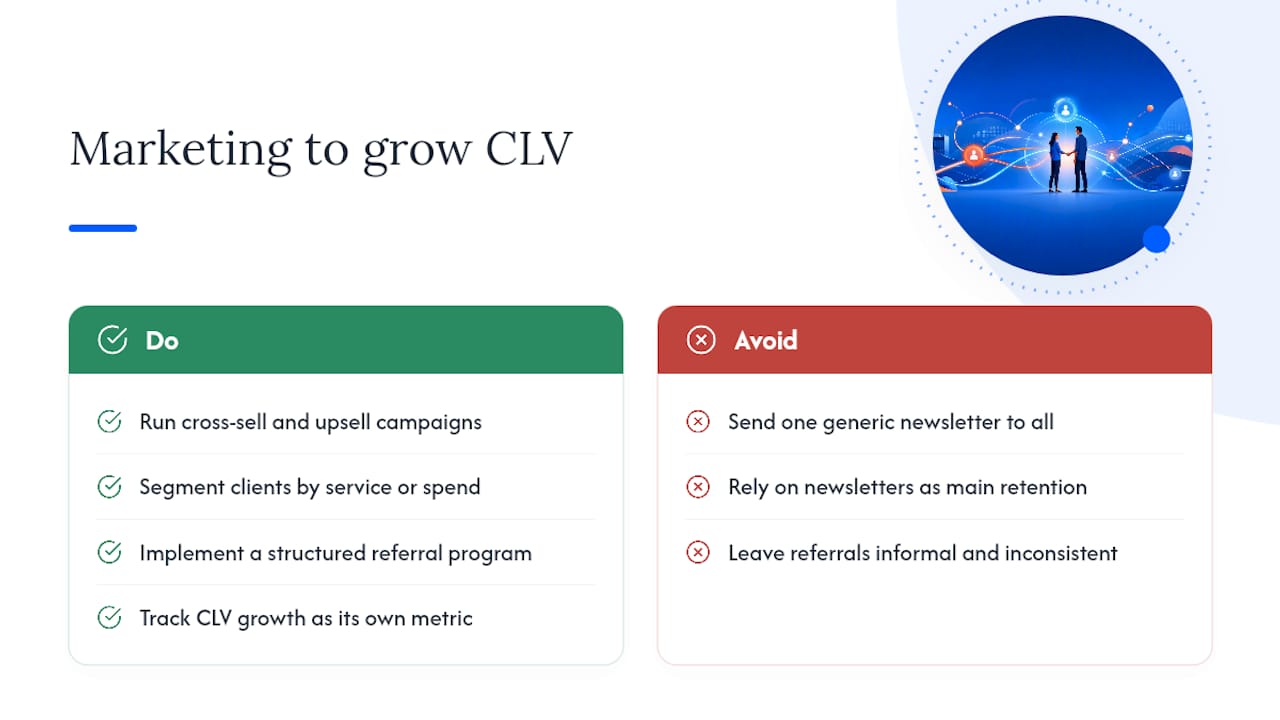
CLV isn’t fixed once a client signs on. Marketing continues to shape it long after the sale, through the content, offers, and communication a client receives while they’re already on board. Cross-sell and upsell campaigns aimed at existing clients typically convert at a higher rate than cold acquisition, because the trust barrier is already gone.
Segmenting your client base by service type or spend level lets you build targeted nurture content for each group, rather than sending the same generic newsletter to everyone. A client who bought a one-off audit is a very different marketing target from one on an ongoing retainer, and treating them identically wastes the opportunity to grow either relationship.
Referral programs formalise a growth lever that many service businesses leave informal and inconsistent. If you know your average referred client has a higher CLV than a cold-acquired one, and firms in professional services frequently do, then investing marketing effort in a structured referral ask rather than hoping it happens organically is a straightforward improvement.
The mismatch between popular tactics and actual effectiveness shows up here too. Firms that rely on generic email newsletters as their main retention tool often see less lift than those investing in targeted content built around a client’s specific service history and stage of relationship.
Track CLV growth as its own trend line, separate from new client acquisition. A rising average CLV across your existing base tells you your retention and expansion marketing is working, even if new client numbers stay flat that quarter.
Referrals, networking events, sponsorships, and word of mouth still drive a meaningful share of client acquisition for most service businesses, and none of it shows up neatly in a Google Analytics report. Ignoring offline sources because they’re harder to track creates a distorted picture of what’s actually working.
The fix isn’t sophisticated. Add a simple “how did you hear about us” field to every enquiry form and ask it verbally during discovery calls, then log the answer in the same CRM record you use for digital leads. This lets you calculate CAC and conversion rate across your whole business, not just your digital channels.
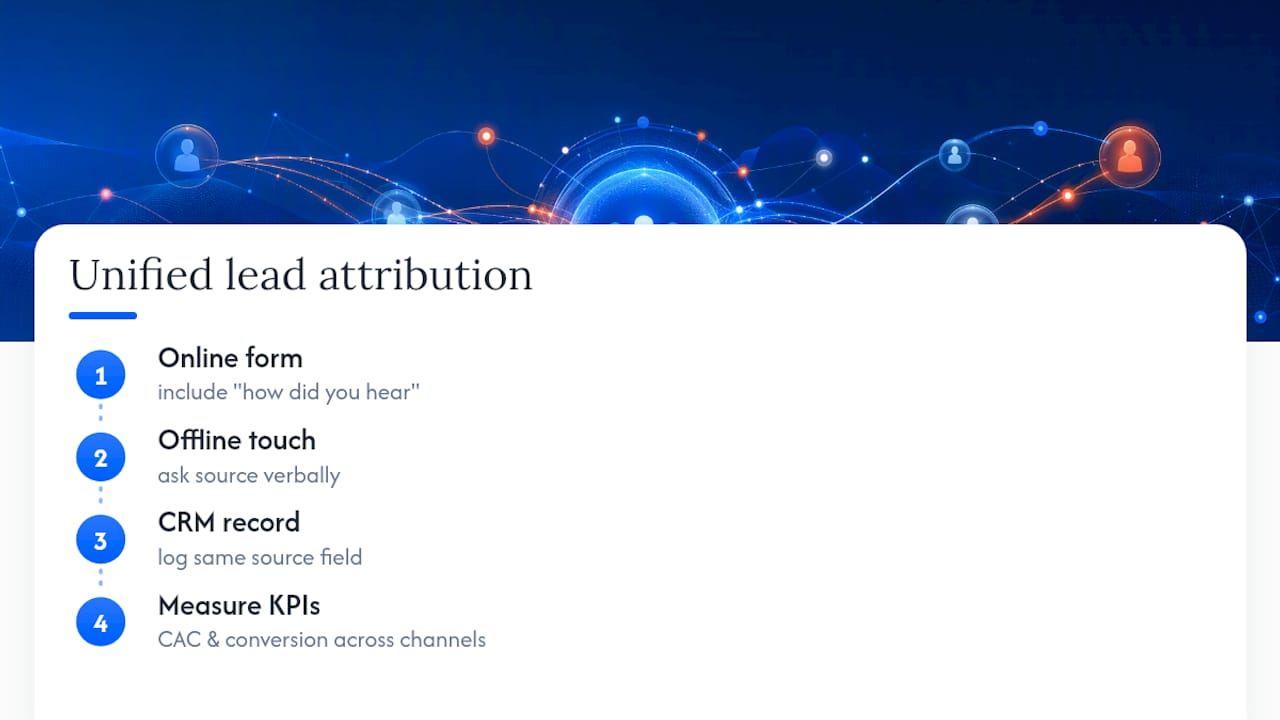
Assign a rough attribution value to offline activity where possible. If you sponsor a local industry event, track how many enquiries mention it by name over the following two months, and calculate a cost-per-lead for that sponsorship the same way you would for a paid ad campaign. It won’t be perfectly precise, but a rough number beats no number.
Networking and referral sources often show up with a shorter sales cycle and a higher close rate than cold digital leads, because the trust element arrives pre-built. That’s worth knowing when you’re deciding where to invest limited marketing time next quarter. A service business marketing framework that maps every channel, online or offline, back to revenue keeps you from over-investing in whichever channel is easiest to measure rather than the one that actually performs.
Building this discipline is exactly what strong website conversion tracking depends on: a single system that treats every lead source the same way, regardless of whether it started with a handshake or a click.
Numbers on a dashboard don’t grow a business on their own. They only matter once you’ve built the habit of checking them weekly, reviewing them monthly, and acting on what they tell you. That’s the exact gap Mybworkshops workshops are built to close, moving you from scattered marketing guesses to a documented marketing engine with clear KPIs at every stage.
If you’ve read this far and don’t yet have a CLV:CAC ratio or a baseline conversion rate written down anywhere, that’s the honest starting point. Some structured workshops walk you through the audit, the dashboard build, and the review rhythm with practical templates and AI prompts, so you’re not guessing your way through a spreadsheet alone. Browse the current workshop program to find the session that matches where your business is right now.
For service businesses, the five that matter most are customer acquisition cost, conversion rate, cost per lead, customer lifetime value, and marketing-attributed revenue, because each one ties directly to pipeline or client value rather than vanity traffic numbers.
Examples include CAC, CPL, conversion rate, MQL to SQL conversion rate, CLV, ROAS, and engagement metrics like content downloads or demo requests, as outlined in the HBS guide to marketing KPIs.
There’s no single KPI for marketing. The right measure depends on your goal: use CPL and conversion rate to judge lead generation, and CAC against CLV to judge whether that spend is actually profitable.
For professional and consulting-style services specifically, the five that industry guidance recommends prioritising are CAC, cost per lead, MQL to SQL conversion, pipeline coverage ratio, and win rate by lead source.
Review leading indicators like leads and CPL weekly, review CAC trends and pipeline value monthly, and review CLV and marketing-attributed revenue quarterly, when you’re making bigger channel and budget decisions.