

Marketing ROI is (Revenue attributed to marketing − Marketing cost) ÷ Marketing cost × 100. That simple version works for a single, well-tracked campaign, like a short paid ad burst with a clear sales page. It falls apart the moment repeat customers, long sales cycles, or multiple channels enter the picture, which is where ROAS, LTV-adjusted ROI, and incremental ROI each answer a different, more honest question.
TL;DR:
- Proper marketing ROI calculation must include all costs such as creative production, staff time, software, and agency fees to avoid overestimating profitability.
- Using lifetime value instead of first-sale revenue provides a more accurate measure of ROI for service businesses with ongoing customer relationships.
- Conducting holdout tests helps determine if marketing channels generate actual incremental sales or just claim credit for naturally occurring revenue.
- Relying solely on platform reports risks misjudging performance due to over-attribution and the need for reconciliation with actual banked revenue.
- Establishing consistent tracking practices, including CRM imports and UTM discipline, is essential for repeatable, reliable ROI analysis and continuous improvement.
The core formula never changes: take the revenue you can genuinely attribute to a marketing effort, subtract what it cost you, divide by that cost, then multiply by 100 to get a percentage. This is the version most guides quote, and Salesforce’s ROI guide treats it as the base calculation for isolated campaigns with clean attribution.
Say you spent $2,000 on a Facebook campaign and it generated $6,000 in tracked sales. For every dollar spent, you got two dollars back on top of the original dollar. Some guides use a slightly different shorthand: (Sales growth − Marketing cost) ÷ Marketing cost, which Investopedia recommends as a quick campaign check when you’re comparing sales growth against spend rather than total attributed revenue.
ROAS is a different animal, even though people use it interchangeably with ROI. ROAS is simply revenue ÷ ad spend, with no cost subtracted. Using the same numbers, ROAS is $6,000 ÷ $2,000 = 3, or “3x.” Criteo’s breakdown of advertising ROI versus ROAS makes the distinction clear: ROAS tells you the revenue multiple, ROI tells you the profit-adjusted return, and the two numbers will never match unless your cost is somehow zero.
For service businesses, neither number captures the full picture, because most of the value shows up after the first invoice. That’s where two more formulas earn their place:
Each formula answers a different question. Simple ROI tells you if a campaign was profitable. ROAS tells you the revenue efficiency of ad spend. LTV-adjusted ROI tells you if a customer relationship was worth acquiring. Incremental ROI tells you whether the marketing caused anything at all.
Most ROI calculations undercount costs and overcount returns, and that combination is what makes a campaign look brilliant on a slide and mediocre in the bank account. Getting this right means being deliberately unforgiving about both sides of the equation.
On the cost side, include every line, not just the obvious one:
On the returns side, the trap is treating whatever a platform dashboard reports as gospel. Platform-attributed revenue is what Meta or Google claims your ads generated. Bankable revenue is what actually landed in your accounting system once refunds, discounts, and double-counted conversions are stripped out. A practical guide to calculating real marketing ROI for Australian SMEs recommends reconciling platform numbers against your CRM or accounting software before you trust any percentage.
Time windows matter too. A paid search campaign might convert within seven days, so a short attribution window makes sense. SEO and content marketing behave differently: a blog post published today might drive its best conversions eight months from now, so judging it on a 30 day window will always undersell it.
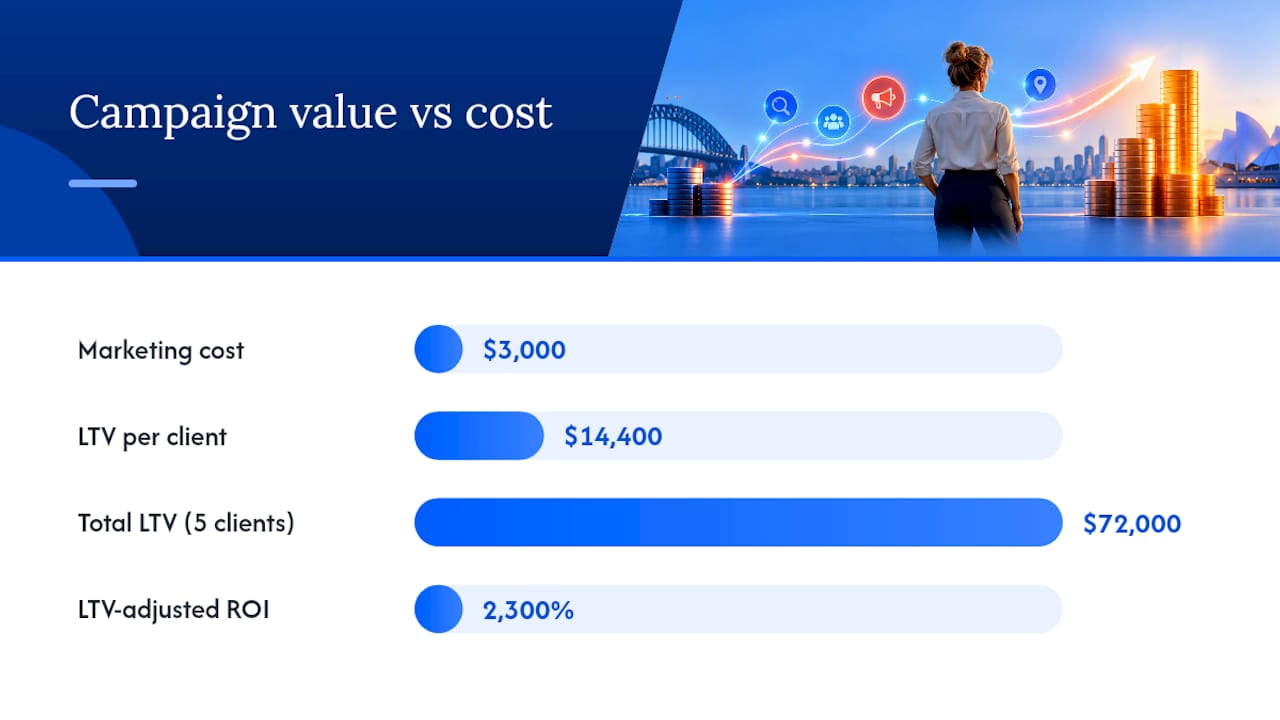
A single-sale ROI calculation can tell you a campaign lost money when, in reality, it built a customer relationship worth ten times the acquisition cost. That’s the core argument for adjusting ROI by lifetime value, particularly for service businesses where the first job is rarely the profitable one.
Lifetime value (LTV) is calculated as:
Average order value × Purchase frequency × Customer lifespan
If a bookkeeping client pays $400 a month, stays for three years, that’s $400 × 12 × 3 = $14,400 in lifetime value.
Once you have a trustworthy LTV figure, the adjusted formula becomes:
(LTV × New customers acquired − Marketing cost) ÷ Marketing cost × 100
Compare that to a simple first-invoice ROI, which might show a loss if the first job was quoted at cost to win the account. 3P Digital’s guide to forecasting marketing ROI makes the case that this LTV view is essential for service businesses, because repeat business and referrals are where most of the profit actually sits.
The other adjustment worth making is incrementality. A holdout test, where you pause ads in one region or for one audience segment and compare sales against a matched control group, tells you whether the campaign is creating new revenue or just claiming credit for sales that would have happened anyway. Shopify’s comparison of ROAS and ROI recommends exactly this kind of control-group approach over relying solely on platform attribution.
Pro Tip: Run your first holdout test on your cheapest, highest-volume channel. If pausing it barely dents total sales, you’ve just found budget you can redirect somewhere that actually needs it.
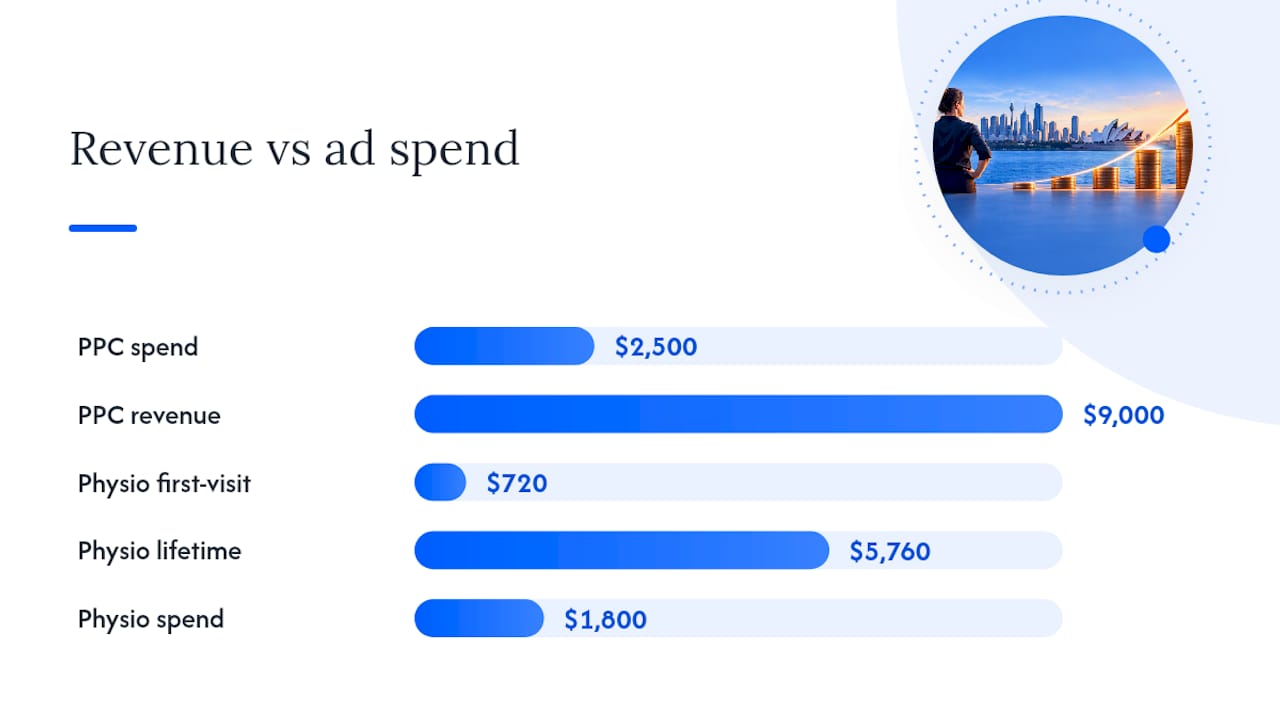
Numbers on a page are one thing. Watching two different views of the same business change the verdict is what actually sticks. Here’s a PPC campaign, viewed the simple way first.
| Input | Value |
|---|---|
| Ad spend | $2,500 |
| Attributed revenue | $9,000 |
| Simple ROI | 2300% |
| ROAS | 3.6x |
ROAS is $9,000 ÷ $2,500 = 3.6. Both numbers look healthy, and for a one-off product sale, that’s the end of the story.
Now take a service business, where the first sale doesn’t tell the whole truth:
The first-sale view says the campaign failed. The lifetime view says it was one of the better decisions the clinic made that quarter. Neither number is wrong, they’re just answering different questions, which is exactly why the formula you choose has to match the decision you’re making.
To run this yourself, a spreadsheet needs just five inputs: total cost, attributed revenue (or units sold), average order value, purchase frequency, and estimated customer lifespan.
The most common error is trusting the platform dashboard as if it were an independent auditor. Google Ads and Meta both have a financial incentive to report generous attribution, and research into attributed versus incremental conversions found that a meaningful chunk of “attributed” sales would have happened without the ad running at all.
A few other traps show up constantly:
Pro Tip: Set your attribution window by sales cycle, not by habit. If your average client takes six weeks to decide, a seven-day attribution window will always make your best channels look worse than they are.
None of these formulas mean much if your tracking is inconsistent from one campaign to the next. Three connections make the biggest difference to accuracy.
A minimal spreadsheet with cost, revenue, LTV inputs, and a payback formula covers most small teams. You don’t need enterprise software to calculate marketing ROI accurately, you need consistent habits and a genuine understanding of the KPIs that matter for your particular business, like LTV, CAC, and payback period.
Improving your number starts with trusting it, and that means fixing the inputs before you touch the campaigns themselves.
Pro Tip: A healthy LTV:CAC ratio sits around 3:1 or higher for most service businesses. If yours is closer to 1:1, you’re spending nearly as much to win a client as that client is worth, which is a budget problem, not a marketing problem.
Calculating marketing ROI properly is one thing, building the habits, tracking, and offers that actually improve it is another. Some providers offer structured, step-by-step workshops for service business owners seeking a repeatable system for measurement, lifetime value, and conversion.

Where a formula tells you what happened last quarter, the Lead Generation System Workshop ($350 AUD per year) walks you through building the tracking and nurture sequences that make next quarter’s numbers easier to trust, with templates you can implement straight away rather than a slide deck you file away. If your bigger issue is direction rather than tracking, that usually starts with the Business Strategy Workshop ($1,495 AUD per year), which includes 12 months of access and live Q&A rather than a one-off video you watch once and forget. Browse the full workshop lineup to find the phase that matches where your marketing engine actually is right now, then book in and start working from real numbers instead of guesswork.
It’s a useful starting allocation, but you still need to calculate marketing ROI on each slice to know if the split is actually working.
A commonly cited benchmark is a 5:1 revenue-to-cost ratio, meaning $5 in attributed revenue for every $1 spent, though the right number depends heavily on your margins and industry. A service business with high lifetime value can profit at a lower ratio than a low-margin retailer needs to break even.
The standard formula is (Revenue attributed to marketing − Marketing cost) ÷ Marketing cost × 100, expressed as a percentage, as outlined in Salesforce’s ROI guide. For service businesses, swapping in lifetime value instead of first-sale revenue usually gives a more honest answer.
It’s a modest but positive result, and whether it’s “good enough” depends on your margins, payback period, and what else that budget could have funded instead.