

A website conversion rate optimization workflow is a structured sequence of analysis, hypothesis formulation, testing, and measurement that systematically increases the percentage of visitors who complete a desired action. For Australian small and medium businesses, a sustained professional approach to this process yields a 30–80% improvement in conversion rates over 12 months. The industry term for this discipline is conversion rate optimisation, or CRO. Understanding the full workflow, from data collection through to iterative testing, is what separates businesses that grow steadily from those that keep spending on traffic without results.
A CRO workflow begins with the right data, not with design changes. Without reliable data, every decision is a guess, and guesses rarely move the needle.
Google Analytics 4 (GA4) is the starting point for any conversion optimisation process. Before you analyse anything, audit your GA4 setup to confirm that key events are tracked correctly. These events include form submissions, button clicks, phone number taps, and page scroll depth. If your event tracking is broken or incomplete, your data will mislead you.

Page speed is also a technical prerequisite. A 100ms delay in load time causes a 7% drop in conversions. Target a Largest Contentful Paint (LCP) score under 2.5 seconds before running any tests. Fixing speed issues first means your test results reflect real user behaviour, not a broken experience.
Heatmaps and session recordings reveal behavioural insights that analytics alone cannot show. A heatmap tells you where visitors click, scroll, and stop reading. A session recording shows you exactly what a real visitor did before they left. Tools like Hotjar and Microsoft Clarity offer these features and both have free tiers suitable for small business sites.
Exit surveys are another underused qualitative tool. A single question, such as “What stopped you from getting in touch today?”, placed on exit intent, can surface objections you never anticipated. These responses become the raw material for your hypotheses.
| Purpose | Tool type | Example tools |
|---|---|---|
| Quantitative analytics | Web analytics platform | GA4, Google Search Console |
| Qualitative behaviour | Heatmaps and recordings | Hotjar, Microsoft Clarity |
| On-page testing | A/B testing platform | Google Optimize alternatives, VWO |
| User feedback | Exit surveys and polls | Hotjar surveys, Typeform |
| Page speed | Performance auditing | Google PageSpeed Insights, GTmetrix |
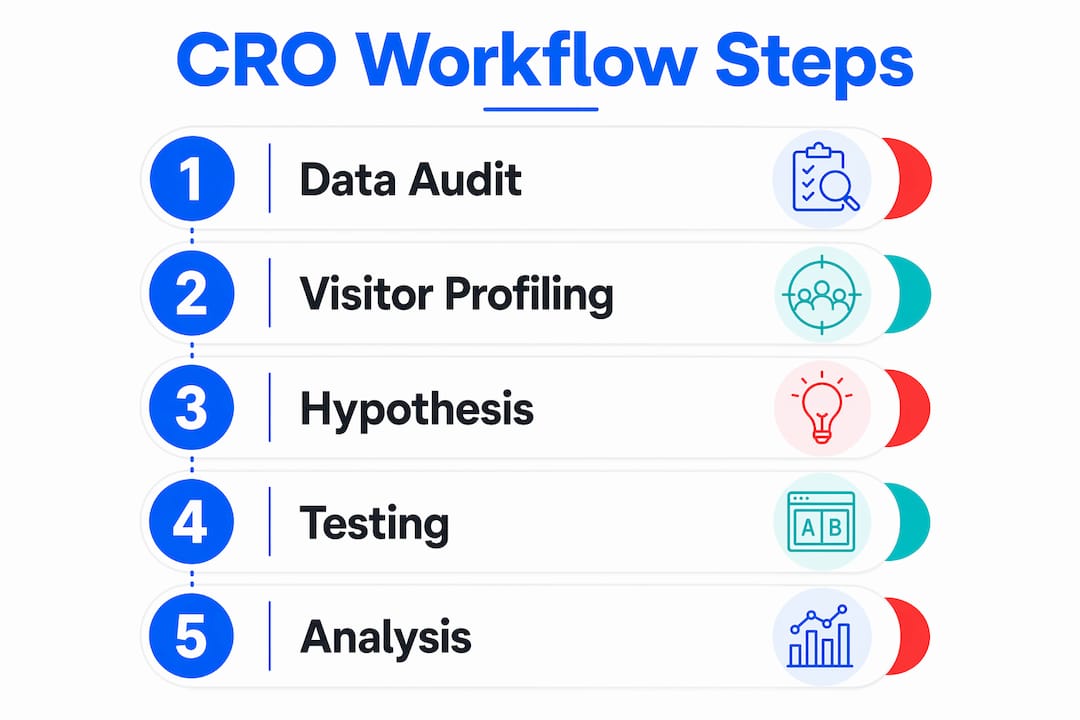
Jumping to solutions before profiling the problem is the biggest CRO mistake service businesses make. Structured profiling replaces guesswork with evidence.
Start by segmenting your conversion data in GA4. Break your traffic into three key dimensions: device type, traffic source, and landing page. Each segment tells a different story.
Mobile conversions lag desktop by 30–50% in Australia. That gap is not just a design problem. It reflects slower mobile connections, smaller screens, and different user intent. If your mobile conversion rate is significantly lower than desktop, your highest-priority work is on the mobile experience, not on desktop tweaks.
Traffic source segmentation is equally revealing. Visitors from Google Ads often have higher intent than visitors from social media. If your paid traffic converts poorly, the issue may be a mismatch between the ad promise and the landing page experience. Check whether your landing page strategies align with what each traffic source expects to find.
GA4’s funnel exploration report shows you exactly where visitors leave your conversion path. A typical service business funnel moves from homepage to service page to contact page to thank you page. If 80% of visitors drop off between the service page and the contact page, that is your “leaky bucket.” Fix that step before touching anything else.
Most visitors drop off within the first 15 seconds on service business sites. This makes above-the-fold clarity and a visible call-to-action your first priority on any high-traffic page.
Pro Tip: Combine your GA4 funnel data with session recordings for the same page. The numbers tell you where people leave; the recordings show you why.
Australian businesses can also localise their profiling. If you serve specific suburbs or regions, filter your GA4 data by city to see whether conversion rates differ by location. Suburb-specific testimonials and local trust signals can lift conversions faster than a full redesign.
A CRO hypothesis is a specific, testable prediction about what change will improve a conversion metric and why. Vague ideas like “make the page look better” are not hypotheses. They are opinions.
A strong hypothesis follows this structure: “If we change [variable], then [predicted outcome] will occur, because [rationale from data].” For example: “If we move the contact form above the fold on the services page, then form submissions will increase, because session recordings show that 60% of visitors never scroll past the hero image.”
ICE scoring ranks each hypothesis by three factors: Impact (how much will it move the conversion metric?), Confidence (how strong is the data supporting it?), and Ease (how quickly can you build and launch the test?). Score each factor from 1 to 10 and multiply them together. The highest scores go to the top of your testing queue.
ICE scoring prevents a common trap: spending weeks building a test that looks impressive but has little evidence behind it. It keeps your workflow focused on changes that move business metrics, not just design preferences.
Pro Tip: Prioritise hypotheses that connect directly to revenue. A 10% lift in contact form submissions matters more than a 10% lift in time on page.
For low-traffic sites, traditional A/B testing can take months to reach significance. In these cases, focus on “big rock” changes, such as rewriting your entire value proposition or restructuring your page layout, and track micro-conversions like scroll depth and click-through rate as directional signals.
Running a test without a clear plan produces data you cannot trust. Controlled experiments require discipline at every step.
Stopping a test early because the numbers look good is like reading the first chapter of a book and deciding you know the ending. The result you see on day five is almost never the result you would see on day thirty. Patience is not optional in a CRO workflow. It is the discipline that separates reliable insights from expensive mistakes.
If you notice a sudden traffic spike or a technical issue during a test, pause it and investigate before drawing conclusions. Data pollution from an unrelated campaign or a site outage can invalidate weeks of work.
CRO is not a one-off project. Continuous, iterative cycles build an optimisation engine that compounds gains over time. A single test might lift your conversion rate by 15%. A year of monthly tests, each building on the last, can produce the kind of 30–80% annual improvement that transforms a business’s pipeline.
The most practical structure for small business owners is a monthly sprint following the Analyse, Hypothesise, Build, Measure cycle. Each sprint produces one completed test and one documented learning. Over 12 months, that is 12 experiments and a growing body of knowledge about what your specific audience responds to.
Common mistakes that stall CRO programmes include:
Connecting your website performance improvement work to real business outcomes keeps the programme funded and prioritised. When you can show that a landing page test produced 20 additional enquiries last month, the case for continuing the programme makes itself. You can also explore how email conversion rates fit into your broader optimisation system, since CRO does not stop at the website.
A structured CRO workflow is only as strong as the marketing foundation beneath it. If your website lacks clear positioning, a defined audience, or a consistent message, no amount of testing will fix the underlying problem.
Mybworkshops offers expert-led workshops built specifically for service-based business owners who want to move from guesswork to a system. The workshops cover website strategy, lead generation, and traffic, giving you the skills to run your own optimisation programme with confidence. Real clients have used this framework to increase conversions and reduce wasted ad spend. Browse the full workshop programme to find the right starting point for your business, or explore the website strategy workshop to build the foundation your CRO efforts need.
A sustainable website conversion rate optimisation workflow requires profiling visitor behaviour with data, forming specific hypotheses, running controlled tests for at least four weeks, and iterating monthly to compound gains over time.
| Point | Details |
|---|---|
| Start with clean data | Audit GA4 event tracking and fix page speed before running any tests. |
| Segment before you act | Break down conversions by device, source, and page to find your highest-priority fix. |
| Write specific hypotheses | Use the “if, then, because” structure and score each idea with ICE before testing. |
| Test one variable at a time | Isolating a single change is the only way to know what actually drove a result. |
| Iterate monthly | Monthly sprints following the Analyse, Hypothesise, Build, Measure cycle compound gains across 12 months. |
A CRO workflow is a repeating cycle of data analysis, hypothesis creation, A/B testing, and measurement designed to increase the percentage of website visitors who take a desired action. It replaces ad hoc changes with a structured, evidence-based process.
A/B tests on small and medium business sites should run for a minimum of four weeks to account for weekly traffic patterns and avoid false positives from short-term data spikes.
GA4 for analytics, a heatmap tool such as Hotjar or Microsoft Clarity for behavioural data, and a basic A/B testing platform are the core tools needed to begin a conversion optimisation process.
Use ICE scoring to rank your test ideas by Impact, Confidence, and Ease. The highest-scoring ideas, backed by the strongest data, go to the top of your testing queue.
Low-traffic sites should focus on large structural changes and track micro-conversions such as scroll depth and click-through rate rather than relying on traditional A/B testing, which requires significant traffic to reach statistical significance.